ChatGPT is widely known for being one of the most impressive AI technologies for generating text. However, many users are wondering if ChatGPT can draw diagrams, charts, and graphs because of the increasing capabilities of AI chatbots which are drawing attention online. ChatGPT is one of the advanced language models that is capable of providing impressive human-like responses. However, ChatGPT does not believe it can develop a diagram as it will complain about an error when the user asks to make Graphs, charts, and diagrams. However, with the help of a language model called Mermaid script, ChatGPt can draw diagrams and graphs easily. It is one of the most efficient tools which is available in ChatGPT which provides a huge advantage to the user if used to its full potential. Anyhow, the feature is only available in ChatGPT Plus which costs $20/month. Thus, the user of ChatGPT can enjoy this feature by following a few easy steps and drawing graphs, charts, and diagrams.
- Generate SVG code– If the user wants to create a figure using ChatGPT, it is important for the user to generate the SVG code that produces easy-to-understand and visually striking diagrams. The user needs to write the prompt “A white rectangle with green borders, create the following text inside the rectangle: hello world!”. This will generate the SVG code through which the user can create graphs, diagrams, and charts.
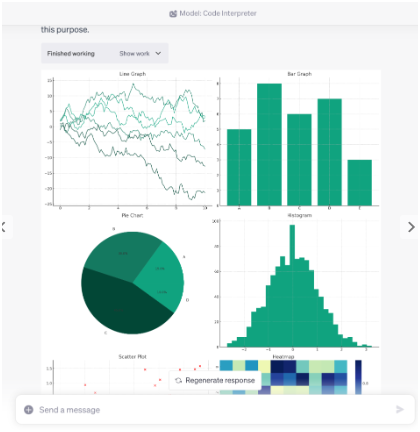
- Once the user enables the SVG code, the user can simply start by asking ChatGPT about the abilities of its data visualization. The user enabling the code interpreter gives the ability to create line graph pie charts, bar graphs, histograms, scatter plots, heat maps, and more. Thus, the user can easily draw, graphs, charts, and diagrams in ChatGPT Plus by enabling a data interpreter.
- The user now needs to simply upload their data after interpreting the code and ask the ChatGPT data interpreter to visualize the data. At this stage, the user needs to add the data and figures for which they want to create graphs, charts, or diagrams such as world population data and sample size of the survey participants. They can simply upload different formats such as XLS, CSV, or XLSX datasets to develop the needed graph or figure.
- The user can also modify the graph, diagrams, or charts by asking the Code interpreter to make the graph look good. The user can simply use the ChatGPT prompt “make the graph nicer with better color and labels”. This prompt will help the user to modify the chart, graph, and diagrams to make the graph look understandable and present in a better way.
- The user can also make the charts, graphs, and diagrams more interesting by asking the Code Interpreter of ChatGPT to “find key insights from the data”. This will help the user to visualize and find the key insights from the graph and charts to gain a better understanding of the data and information provided in the chart. Thus, the user can develop charts, graphs, and diagrams which the viewer can easily understand.
- Besides making graphs, charts, and diagrams more interesting, the user can also create a scatter plot which can help them to compare two variables of the provided data. A scatter plot diagram will help the user to represent different values from different numeric variables and position each dot vertically and horizontally to observe the relationship between variables.
Users, who have subscribed to ChatGPT Plus can easily gain access to ChatGPT plugins which can help them to visualize data. The user simply needs to launch ChatGPT and move to the GPT-4 model. The user then needs to select the “Plugins” option and open the plugin store and install “Show me diagrams plugins”. Thus, following these steps can help the user of ChatGPT Plus to draw graphs, diagrams, and charts in ChatGPT.